Forum Replies Created
-
AuthorPosts
-
September 5, 2023 at 2:23 pm #195327
Yu-Wei Chang
ModeratorHi Jo-Hsin,
Many thanks! Please don’t hesitate to reach out if you have any questions or need assistance.
August 28, 2023 at 6:22 pm #194791ModeratorHi Jo-Hsin,
Thank you for your feedback on using BRAPH 2.
Absolutely, it is possible to extract the learned parameters from a trained neural network model.
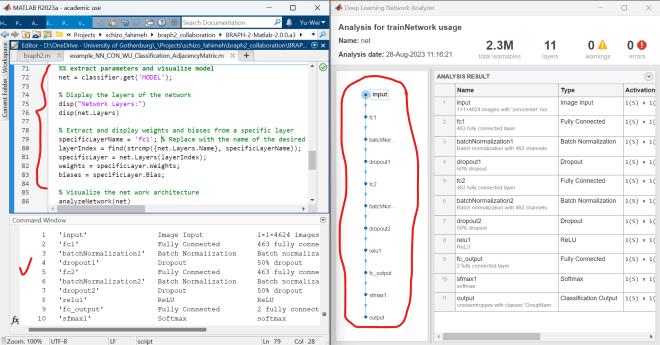
Let me guide you through the process using the “example_NN_CON_WU_Classification_AdjacencyMatrix.m” script as an illustration. After line 69, kindly integrate the following code segment:
%% extract parameters and visualize model
net = classifier.get('MODEL');

% Display the layers of the network
disp("Network Layers:")
disp(net.Layers)

% Extract and display weights and biases from a specific layer
specificLayerName = 'fc1'; % Replace with the name of the desired layer
layerIndex = find(strcmp({net.Layers.Name}, specificLayerName));
specificLayer = net.Layers(layerIndex);
weights = specificLayer.Weights;
biases = specificLayer.Bias;

% Visualize the net work architecture
analyzeNetwork(net)
In this code segment, the script first displays all layers within the model. Subsequently, it extracts the parameters (weights and biases) for a specified layer (in this case, ‘fc1’ – the first fully connected layer). Finally, it provides a visual representation of the overall model architecture.
I hope this reply addresses your question. Please feel free to reach out if you require further clarification.
Best,
Yu-Wei-
This reply was modified 2 years, 11 months ago by
Yu-Wei Chang.
-
This reply was modified 2 years, 11 months ago by
-
This reply was modified 2 years, 11 months ago by
-
This reply was modified 2 years, 11 months ago by
July 6, 2023 at 5:31 pm #191619ModeratorHi Nabin,
Thank you for choosing BRAPH 2. I’m here to help you with visualizing matrices at different densities using the GUI. Here are the steps:
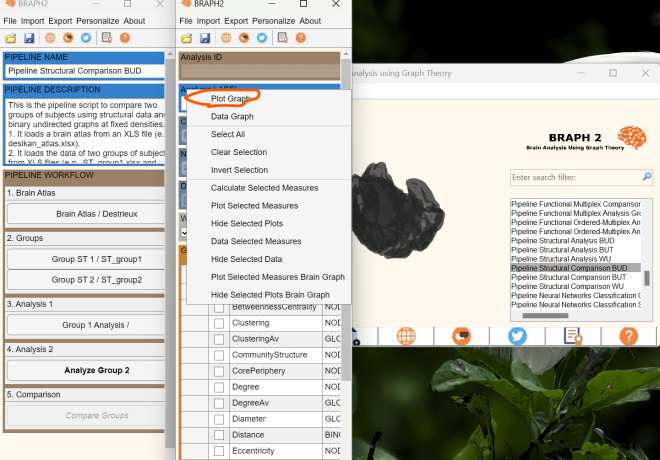
- Right-click on the graph measure panel and a list will pop out. You can refer to the following screenshot.
- Click on “Plot Graph” in the list. A new window will appear, showing the corelation matrices at the first density.
- To switch between densities, click on “Settings Panel” as shown below. The setting panel will open, and you can navigate to the DT (Density Thresholding) section.

By following these steps, you will be able to visualize the matrices at different densities. I also recommend checking out our tutorial on “Pipeline Structural Comparison BUT”, which provides a comprehensive guide on various aspects, including graph measure analysis and brain surface visualization.
Feel free to reach out if you have any further questions. We’re here to assist you!
Best regards,
Yu-Wei-
This reply was modified 3 years ago by
-
This reply was modified 3 years ago by
-
This reply was modified 3 years ago by
April 21, 2023 at 1:53 pm #178656ModeratorHi Sai,
The reference manual for braph2 is already included automatically in the software. If you want to know the properties (e.g., P for CompareEnsemble or P1, P2, DIFF for ComparisonEnsemble), you can simply type the following commands in the MATLAB command window:
help CompareEnsemble
and
help ComparisonEnsembleThese commands will show you the description of all the properties related to CompareEnsemble and ComparisonEnsemble as attached:

In the description, you will find the answers you wanted:
– P (parameter, scalar) is the permutation number.
– DIFF (result, cell) is the ensemble comparison value.
– P1 (result, cell) is the one-tailed p-value.
– P2 (result, cell) is the two-tailed p-value.
– CIL (result, cell) is the lower value of the 95%% confidence interval.
– CIU (result, cell) is the upper value of the 95%% confidence interval.I also recommend checking our freely available tutorials online that explain how to perform graph and deep learning analysis using braph2. You can access them through this link: http://braph.org/tutorials/pipelines/pipeline-functional-comparison-bud/.
Let me know if you have any further questions.
Best,
Yu-WeiApril 20, 2023 at 7:11 pm #178361ModeratorHi,
Nice, thank you!
Best,
Yu-WeiApril 20, 2023 at 10:39 am #178303ModeratorHi,
Thanks for the further information.
Yes, based on your feedback, it sounds reasonable since, if I understand you correctly, you calculated all the available measures for all 800 subjects.Should you have any questions, please feel free to write to us.
Best, Yu-Wei
April 20, 2023 at 8:21 am #178289ModeratorHi,
Thanks for the feedback.
May you provide further information:
what is the size of the adjacency matrix in your case? Additionally, I wanted to ask two things: (1) how long does it take to run the modified example file, example_FUN_WU.m, on your computer? and (2) have you installed the parallel computing toolbox?For reference, on my computer with the parallel computing toolbox installed, each step in the modified example file example_FUN_WU.m took the following amount of time:
– Load BrainAtlas: 11 secs
– Load Groups of SubjectFUN: 36 secs
– Measures calculation (Strength, StrengthAv, and Distance): 460 secs
– Comparison (Strength and modularity): 272 secs
– Get individual correlation matrices and graph measures: 1 secTherefore, if the comparison is not of your interest, you may skip the comparison calculation and save some time, which are the following lines:
% comparison c_WU = CompareEnsemble( ... 'P', 10, ... 'A1', a_WU1, ... 'A2', a_WU2, ... 'WAITBAR', true, ... 'VERBOSE', false, ... 'MEMORIZE', true ... ); strength_WU_diff = c_WU.getComparison('Strength').get('DIFF'); strength_WU_p1 = c_WU.getComparison('Strength').get('P1'); strength_WU_p2 = c_WU.getComparison('Strength').get('P2'); strength_WU_cil = c_WU.getComparison('Strength').get('CIL'); strength_WU_ciu = c_WU.getComparison('Strength').get('CIU'); modularity_av_WU_diff = c_WU.getComparison('Modularity').get('DIFF'); modularity_av_WU_p1 = c_WU.getComparison('Modularity').get('P1'); modularity_av_WU_p2 = c_WU.getComparison('Modularity').get('P2'); modularity_av_WU_cil = c_WU.getComparison('Modularity').get('CIL'); modularity_av_WU_ciu = c_WU.getComparison('Modularity').get('CIU');-
This reply was modified 3 years, 3 months ago by
April 18, 2023 at 6:46 pm #177953ModeratorHi,
Thanks for bringing this to our attention. Please click on the “X” button in the top-right corner of the pop-up warning window, as shown in the attached figure, to close it. This will allow the program to proceed to launch the landing GUI of BRAPH2. Let me know if you need any further assistance.

-
This reply was modified 3 years, 3 months ago by
-
This reply was modified 3 years, 3 months ago by
March 21, 2023 at 10:28 am #173810ModeratorHi Sai Prasanna,
Thanks for the follow-up feedback.
I would like to provide further information based on example_FUN_WU.m about the following:
(1) Get individual graph metrics/graph measures.
(2) Get individual correlation matrices/adjacency matrices.Please follow the steps below:
Step 1: Copy and paste the following codes at the end of example_FUN_WU.m
%% Get individual correlation matrices
adjacency_matrices1 = cellfun(@(x) x.get('A'), a_WU1.memorize('G_DICT').getItems, 'UniformOutput', false); % all individuals from group 1
adjacency_matrices2 = cellfun(@(x) x.get('A'), a_WU2.memorize('G_DICT').getItems, 'UniformOutput', false); % all individuals from group 2

%% Get individual graph measure
ms1 = cellfun(@(x) x.getMeasure('Strength').memorize('M'), a_WU1.memorize('G_DICT').getItems, 'UniformOutput', false); % all individuals from group 1
ms2 = cellfun(@(x) x.getMeasure('Strength').memorize('M'), a_WU2.memorize('G_DICT').getItems, 'UniformOutput', false); % all individuals from group 2
Step 2: Run the revised example_FUN_WU.m by clicking on the run button

Step 3: Check the variable adjacency_matrices1 for all individual correlation matrices (weighted-undirected in this example) from group 1, and adjacency_matrices2 for group 2
Step 4: Check the variable ms1 for all individual calculated metrics (strength in this example) from group 1, and ms2 for group 2

Thank you, and let me know if you have any questions.
Best regards,
Yu-Wei-
This reply was modified 3 years, 4 months ago by
-
This reply was modified 3 years, 4 months ago by
-
This reply was modified 3 years, 4 months ago by
-
This reply was modified 3 years, 4 months ago by
August 27, 2022 at 3:30 am #156351ModeratorDear Sang-Won Yoo,
Thank you for your interest in using BRAPH2!
At the moment, please download BRAPH2 via Github, and follow the installation to install BRAPH2.
We will have an alpha version of BRAPH2 on the website soon.If you have any questions regarding the installation, please do not hesitate to contact me.
Best,
Yu-Wei -
This reply was modified 2 years, 11 months ago by
-
AuthorPosts