Visualize correlation matrices

Home Forums General Help (Braph 2.0) Visualize correlation matrices

Viewing 3 posts - 1 through 3 (of 3 total)
  • Author
    Posts
  • #191607
    Nabin Koirala
    Participant

    Hi BRAPH team,

    Is there a way to visualize the correlation matrices ? In BRAPH 1 it was very easy to see them but somehow could not find it in BRAPH 2. I am using structural BUD comparison for my analysis and would like to visualize the matrices at different densities.

    Thank you for your support.

    Best,
    Nabin

    #191619
    Yu-Wei Chang
    Moderator

    Hi Nabin,

    Thank you for choosing BRAPH 2. I’m here to help you with visualizing matrices at different densities using the GUI. Here are the steps:

    1. Right-click on the graph measure panel and a list will pop out. You can refer to the following screenshot.
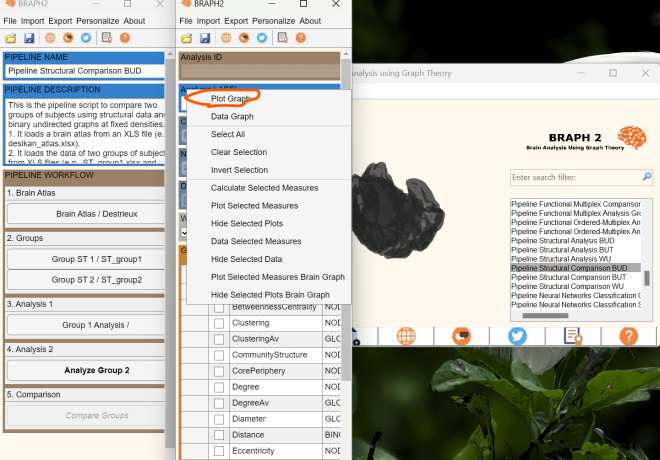
    2. Click on “Plot Graph” in the list. A new window will appear, showing the corelation matrices at the first density.
    3. To switch between densities, click on “Settings Panel” as shown below. The setting panel will open, and you can navigate to the DT (Density Thresholding) section.

    By following these steps, you will be able to visualize the matrices at different densities. I also recommend checking out our tutorial on “Pipeline Structural Comparison BUT”, which provides a comprehensive guide on various aspects, including graph measure analysis and brain surface visualization.

    Feel free to reach out if you have any further questions. We’re here to assist you!

    Best regards,
    Yu-Wei

    • This reply was modified 9 months, 3 weeks ago by Yu-Wei Chang.
    • This reply was modified 9 months, 3 weeks ago by Yu-Wei Chang.
    • This reply was modified 9 months, 3 weeks ago by Yu-Wei Chang.
    #191984
    Nabin Koirala
    Participant

    Thank you.

Viewing 3 posts - 1 through 3 (of 3 total)
  • You must be logged in to reply to this topic.